
Reviewed by Larry Forman, Attorney
This report pulls together ten years of official crash data for Louisville Metro, which covers all of Jefferson County. It counts the people killed and seriously injured in traffic crashes from January 2016 through August 2026, and shows where and when those crashes happen. The main source is Louisville Metro Public Works’ Vision Zero dataset, built from Kentucky State Police crash reports. We checked it against federal fatal-crash data from NHTSA.
From 2021 through 2025, 604 people were killed and 2,369 were seriously injured on Louisville roads. That is about 1.6 people a day. Each one is a person with a family, and many of these crashes were preventable.
Journalists and researchers: you’re welcome to use these figures and charts. Please link to this page and cite the original agency source shown with each table. The full data table is downloadable as a CSV.
Key takeaways
Numbers in this report are for Louisville Metro (Jefferson County), including small cities such as Shively, St. Matthews and Jeffersontown. Unless a table says otherwise, five-year figures cover 2021 through 2025.
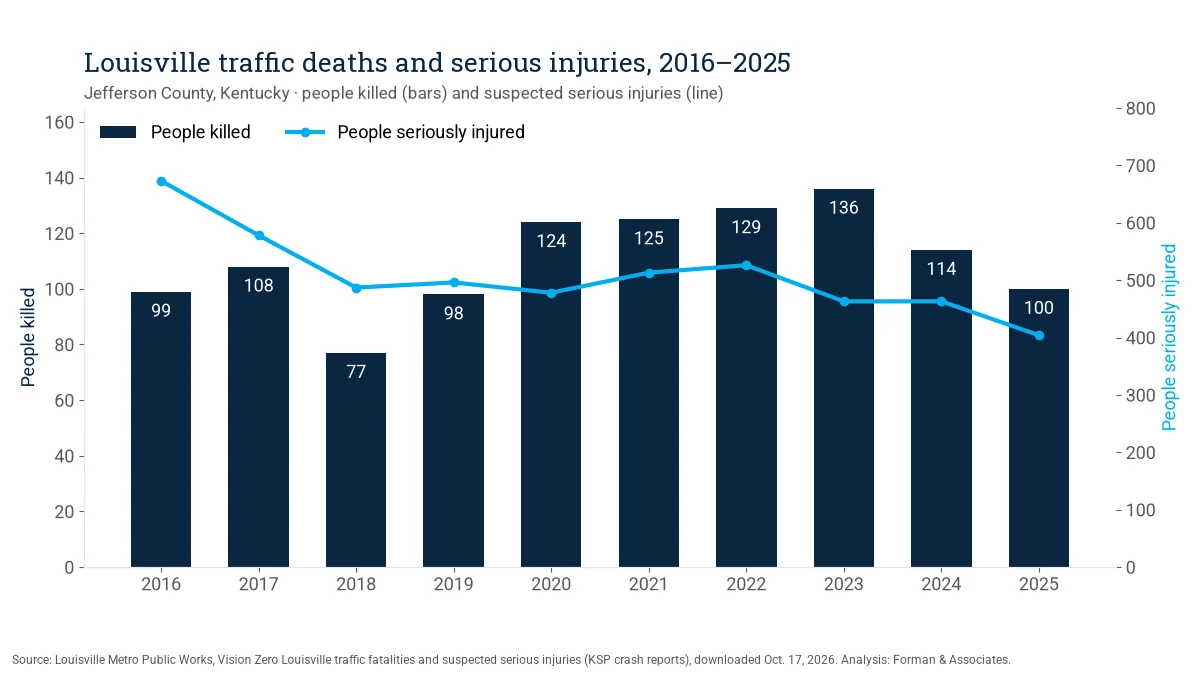
| Year | People killed | People seriously injured | Crashes with a death or serious injury |
|---|---|---|---|
| 2016 | 99 | 673 | 668 |
| 2017 | 108 | 578 | 595 |
| 2018 | 77 | 487 | 501 |
| 2019 | 98 | 496 | 510 |
| 2020 | 124 | 478 | 520 |
| 2021 | 125 | 513 | 558 |
| 2022 | 129 | 526 | 565 |
| 2023 | 136 | 463 | 538 |
| 2024 | 114 | 463 | 514 |
| 2025 | 100 | 404 | 464 |
| Jan.–Aug. 2026 (preliminary) | 67 | 310 | — |
Deaths climbed from 77 in 2018 to a peak of 136 in 2023, then fell two years in a row. Serious injuries have trended down over the 10 years, from 673 in 2016 to 404 in 2025.
Year to date. From January through August, 83 people were killed in 2024, 65 in 2025 and 67 in 2026. Serious injuries in those months went from 326 (2024) to 250 (2025) to 310 (2026). Recent months are preliminary and usually rise as reports are finalized.
Source: Louisville Metro Public Works, Vision Zero Louisville: Traffic Fatalities and Suspected Serious Injuries (built from Kentucky State Police crash reports), data through Aug. 31, 2026, downloaded Oct. 17, 2026. Analysis by Forman & Associates.
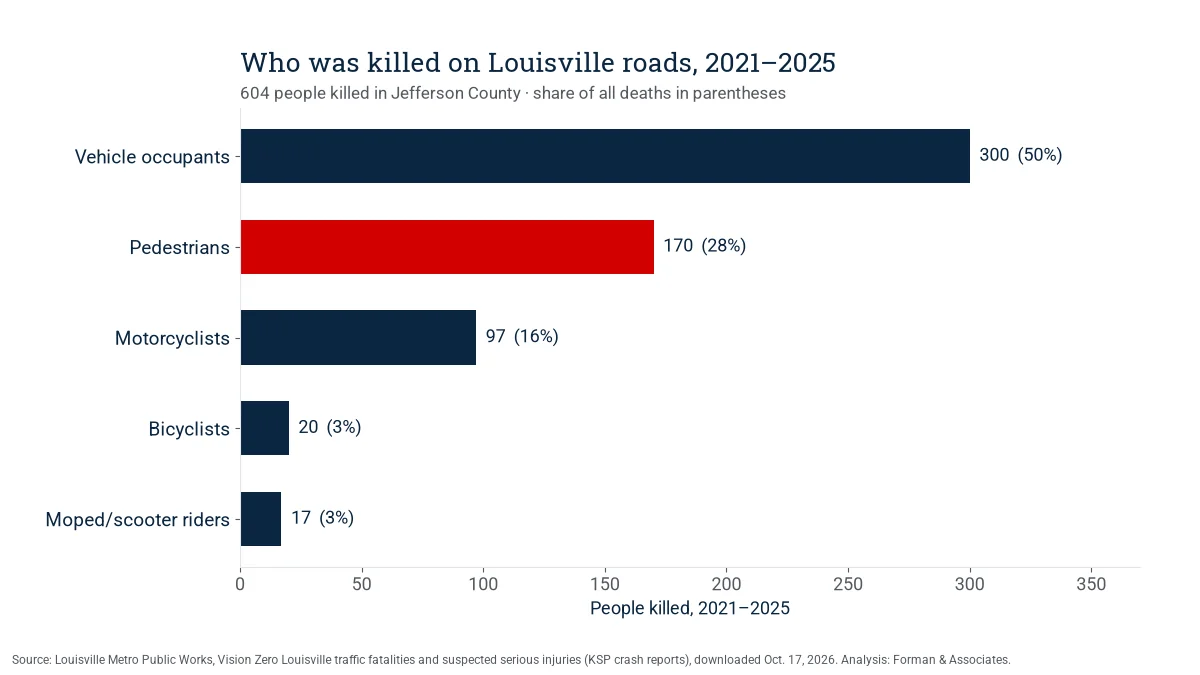
| Road user (2021–2025) | Killed | Seriously injured | Share of deaths |
|---|---|---|---|
| People in cars, trucks and SUVs | 300 | 1,578 | 50% |
| Pedestrians | 170 | 347 | 28% |
| Motorcyclists | 97 | 298 | 16% |
| Moped and scooter riders | 17 | 75 | 3% |
| Bicyclists | 20 | 71 | 3% |
Pedestrians are a small share of travel but a large share of deaths. From 2021 to 2025, 170 pedestrians were killed and 347 were seriously injured. Pedestrian deaths reached a ten-year high of 44 in 2024. By year from 2016: 2016: 24, 2017: 30, 2018: 24, 2019: 29, 2020: 35, 2021: 29, 2022: 35, 2023: 33, 2024: 44, 2025: 29.
83% of pedestrian deaths (141 of 170) happened in dark conditions, lighted or unlighted. Older adults are hit hard: 35 of the pedestrians killed were 65 or older.
Motorcyclists were 16% of the people killed (97) even though motorcycles are a small fraction of vehicles. Bicyclists accounted for 20 deaths and 71 serious injuries, and moped and scooter riders for 17 deaths and 75 serious injuries. Motorcycle deaths by year since 2016: 2016: 18, 2017: 23, 2018: 11, 2019: 17, 2020: 15, 2021: 16, 2022: 21, 2023: 20, 2024: 18, 2025: 22.
For more on these riders’ rights, see our guides for pedestrians, bicyclists and motorcyclists.
Source: Louisville Metro Public Works, Vision Zero Louisville: Traffic Fatalities and Suspected Serious Injuries (built from Kentucky State Police crash reports), data through Aug. 31, 2026, downloaded Oct. 17, 2026. Analysis by Forman & Associates.
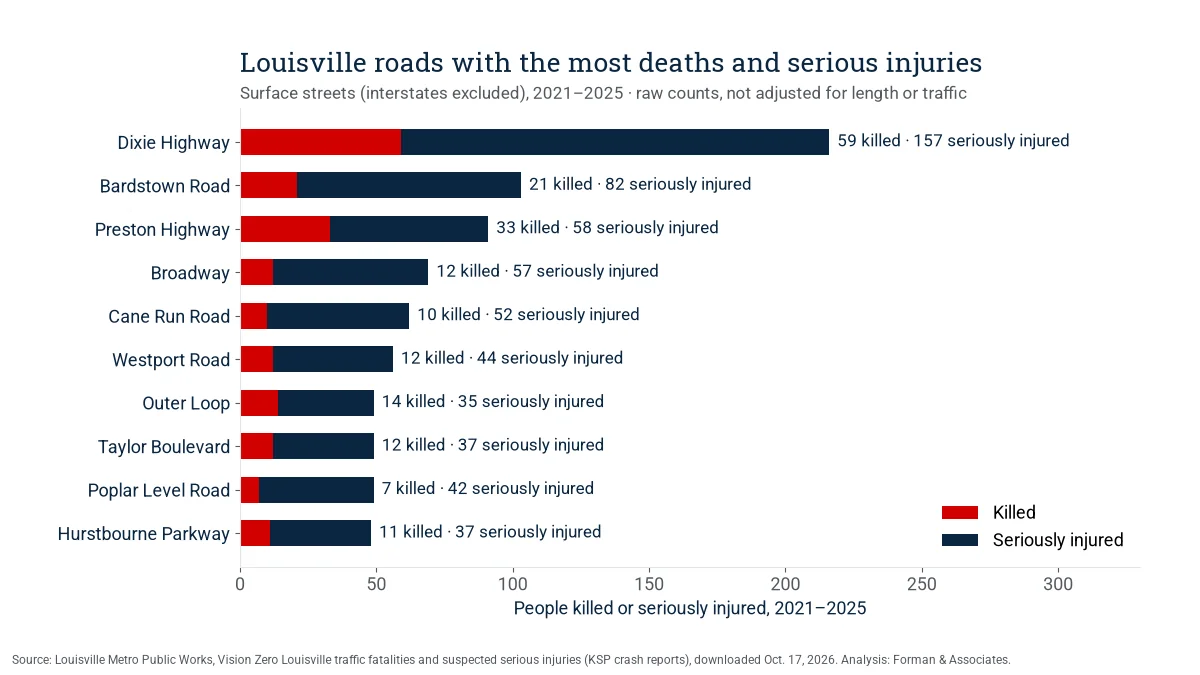
| Road | Killed | Seriously injured | Total people | Of those, pedestrians |
|---|---|---|---|---|
| Dixie Highway | 59 | 157 | 216 | 49 |
| Bardstown Road | 21 | 82 | 103 | 28 |
| Preston Highway | 33 | 58 | 91 | 23 |
| Broadway | 12 | 57 | 69 | 25 |
| Cane Run Road | 10 | 52 | 62 | 9 |
| Westport Road | 12 | 44 | 56 | 7 |
| Outer Loop | 14 | 35 | 49 | 7 |
| Taylor Boulevard | 12 | 37 | 49 | 9 |
| Poplar Level Road | 7 | 42 | 49 | 11 |
| Hurstbourne Parkway | 11 | 37 | 48 | 6 |
| Shelbyville Road | 8 | 39 | 47 | 7 |
| 7th Street Road | 10 | 36 | 46 | 10 |
| Greenbelt Highway | 12 | 32 | 44 | 2 |
| Fern Valley Road | 13 | 29 | 42 | 14 |
| Taylorsville Road | 11 | 31 | 42 | 10 |
The ten roads at the top of this list accounted for 792 of the 2,973 people killed or seriously injured across Louisville (27%). Dixie Highway alone accounted for 216 people, more than twice the next road. Long roads naturally have more crashes, so these totals show where harm is concentrated, not a per-mile risk rate.
| Interstate (Jefferson County segments) | Killed | Seriously injured | Total people |
|---|---|---|---|
| I-264 (Watterson Expressway) | 28 | 109 | 137 |
| I-265 (Gene Snyder Freeway) | 32 | 75 | 107 |
| I-65 | 26 | 72 | 98 |
| I-64 | 26 | 66 | 92 |
| I-71 | 12 | 34 | 46 |
Louisville’s High Injury Network. The city’s own analysis found that 152 miles of roadway, just 5% of Louisville’s non-interstate miles, accounted for 1,213 fatal and serious injury crashes, or 55% of the non-interstate total, in 2018–2022 (Vision Zero Louisville High Injury Network methodology, January 2024).
Road guides: Dixie Highway, Preston Highway, Watterson Expressway (I-264), Gene Snyder (I-265), I-65 and I-64.
Source: Louisville Metro Public Works, Vision Zero Louisville: Traffic Fatalities and Suspected Serious Injuries (built from Kentucky State Police crash reports), data through Aug. 31, 2026, downloaded Oct. 17, 2026. Analysis by Forman & Associates. Road names are standardized from the crash location fields; Gene Snyder Freeway is combined with I-265.
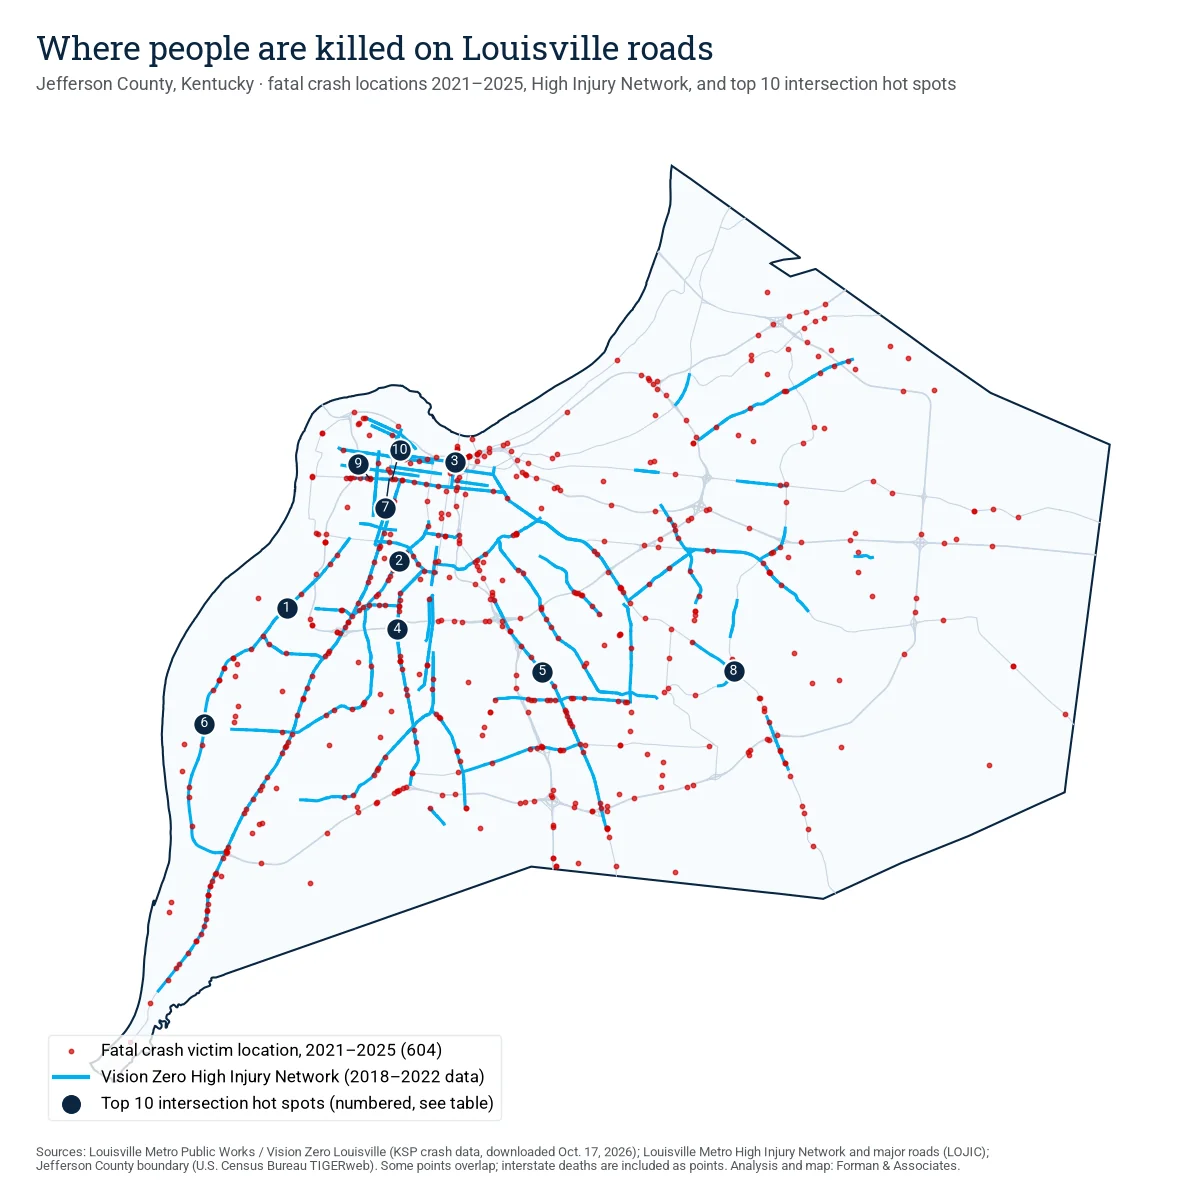
| Rank | Location | Crashes with a death or serious injury | Killed | Seriously injured |
|---|---|---|---|---|
| 1 | Cane Run Road at Crums Lane | 10 | 3 | 7 |
| 2 | 7th Street Road at Central Avenue | 9 | 3 | 10 |
| 3 | Clark Memorial Bridge approach at Main Street | 9 | 3 | 8 |
| 4 | Taylor Boulevard at Ashland Avenue | 9 | 1 | 8 |
| 5 | Preston Highway at Indian Trail | 8 | 5 | 5 |
| 6 | Greenbelt Highway at Greenwood Road | 8 | 1 | 9 |
| 7 | Broadway at 22nd Street | 8 | 0 | 9 |
| 8 | Bardstown Road at Hurstbourne Parkway | 8 | 0 | 8 |
| 9 | Broadway at 28th Street | 7 | 2 | 5 |
| 10 | Broadway at Dr. W.J. Hodge Street | 6 | 1 | 9 |
We grouped crash locations that fell within about 250 feet (75 meters) of each other and ranked the clusters by the number of fatal or serious-injury crashes, then by people killed. Three of the ten hot spots are on West Broadway.
See our guide to intersection crashes in Kentucky and the most dangerous roads in Louisville.
Source: Louisville Metro Public Works, Vision Zero Louisville: Traffic Fatalities and Suspected Serious Injuries (built from Kentucky State Police crash reports), data through Aug. 31, 2026, downloaded Oct. 17, 2026. Analysis by Forman & Associates. Crash coordinates are as recorded on police reports; a few crashes may be placed imprecisely.
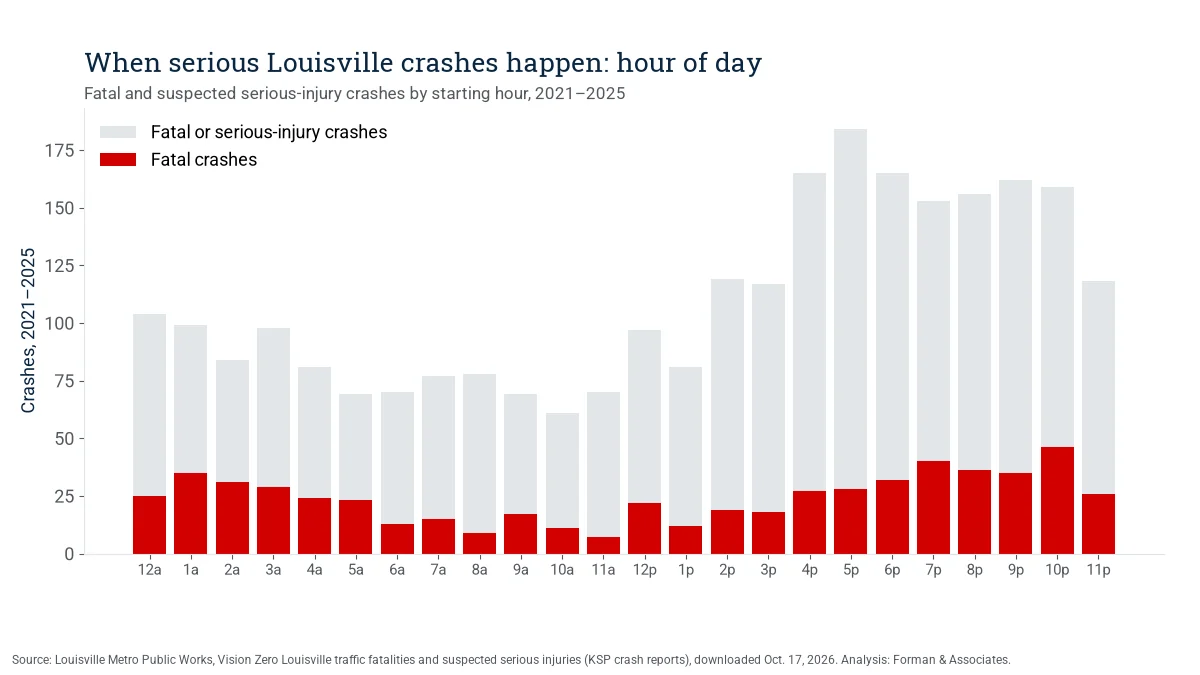
Evening and night are the deadliest. Crashes that killed or seriously injured someone peaked at 5 p.m. (184 crashes). Fatal crashes were most common at 10 p.m. (46). From 6 p.m. to 6 a.m., 1,448 of the 2,639 serious crashes happened (55%), but 400 of the 604 deaths (66%).
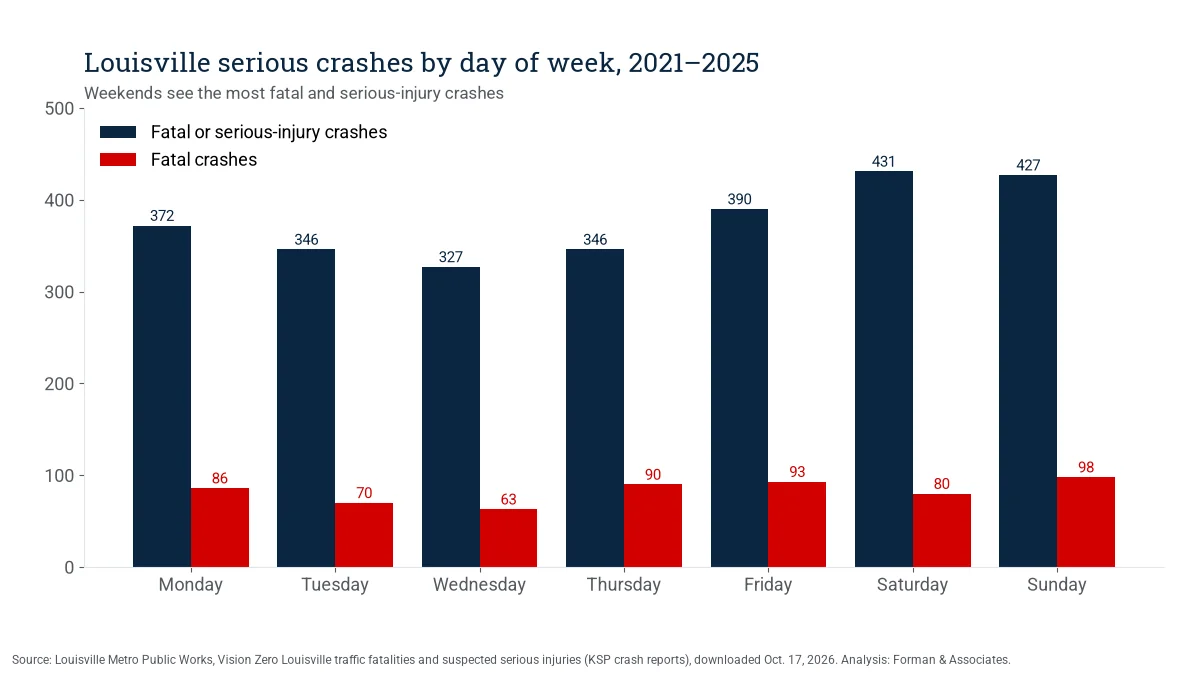
| Day | Crashes with a death or serious injury | Fatal crashes |
|---|---|---|
| Monday | 372 | 86 |
| Tuesday | 346 | 70 |
| Wednesday | 327 | 63 |
| Thursday | 346 | 90 |
| Friday | 390 | 93 |
| Saturday | 431 | 80 |
| Sunday | 427 | 98 |
Weekends are worst. Saturday had the most crashes with a death or serious injury (431), and Sunday had the most fatal crashes (98), followed by Friday (93). By month, August had the most serious crashes over the five years (286) and January the fewest (165).
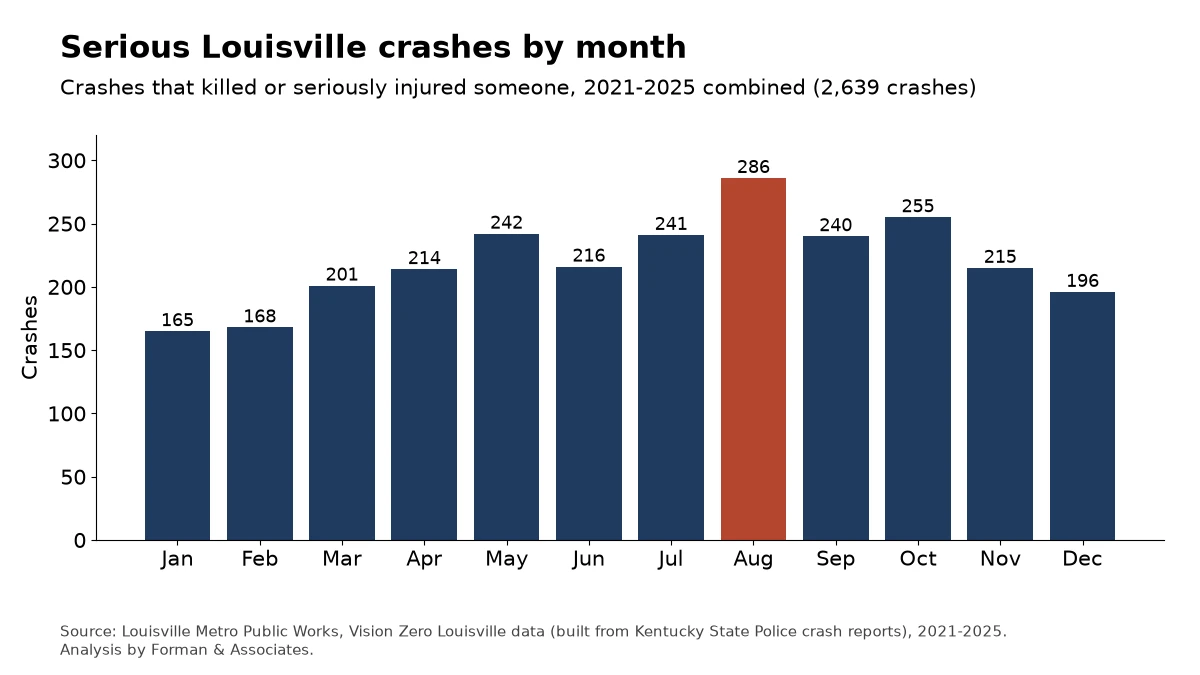
Source: Louisville Metro Public Works, Vision Zero Louisville: Traffic Fatalities and Suspected Serious Injuries (built from Kentucky State Police crash reports), data through Aug. 31, 2026, downloaded Oct. 17, 2026. Analysis by Forman & Associates. Times are local.
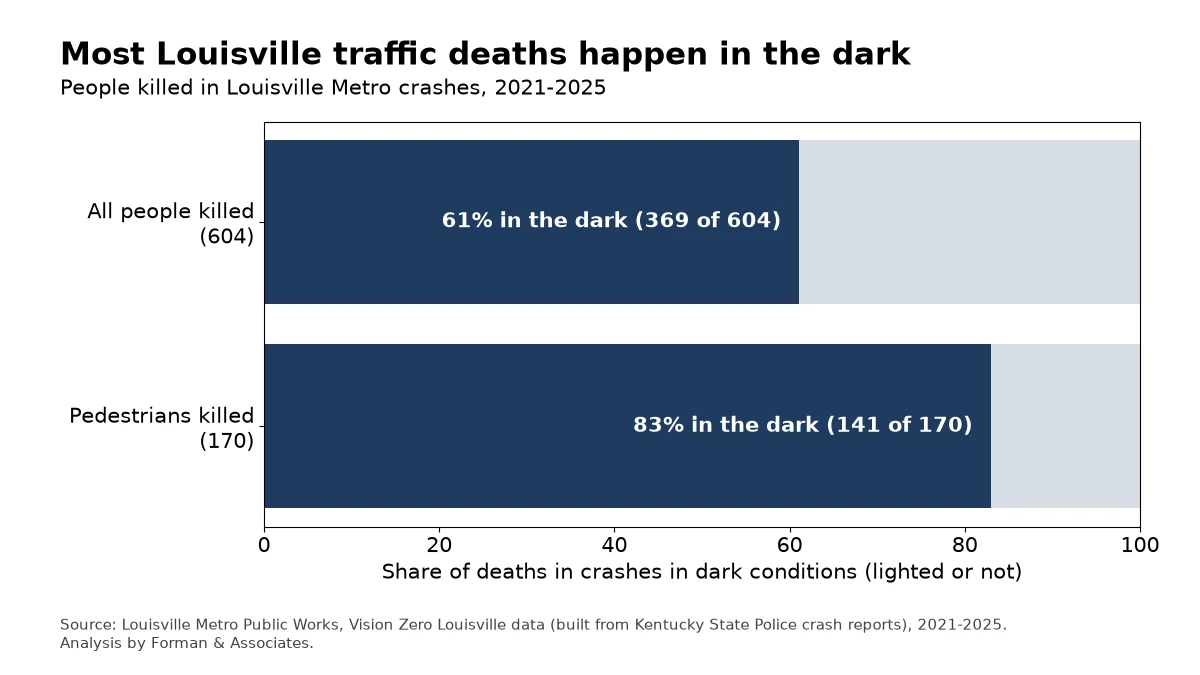
Darkness. 369 of the 604 people killed from 2021 to 2025 (61%) died in crashes in dark conditions, lighted or not. For pedestrians the share was 83%.
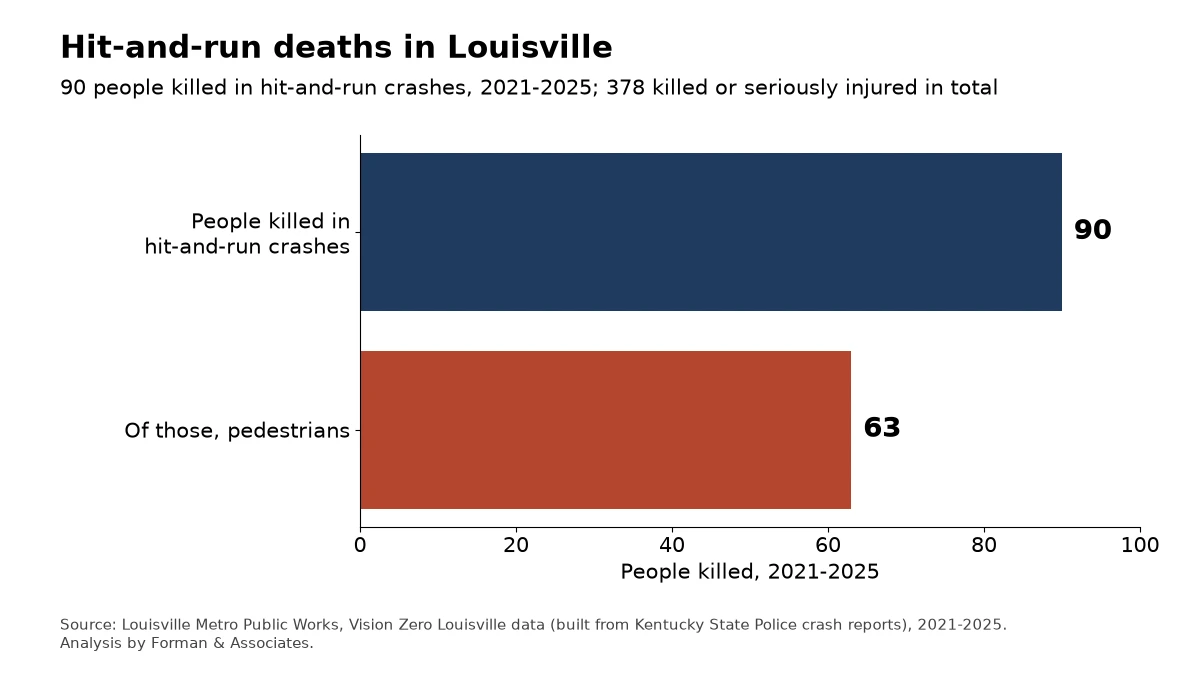
Hit-and-run. 90 people were killed in hit-and-run crashes from 2021 to 2025, and 63 of them were pedestrians. In total, 378 people were killed or seriously injured by a driver who left the scene. Federal data tells the same story: 108 of the 594 fatal crashes in Jefferson County from 2020 to 2024 (18%) were hit-and-runs.
If a driver who fled hurt you, your own uninsured motorist coverage may help. See what to do after a hit-and-run and our uninsured motorist page.
Source: Louisville Metro Public Works, Vision Zero Louisville: Traffic Fatalities and Suspected Serious Injuries (built from Kentucky State Police crash reports), data through Aug. 31, 2026, downloaded Oct. 17, 2026. Analysis by Forman & Associates. Source: NHTSA Fatality Analysis Reporting System (FARS), 2020–2023 Final File and 2024 Annual Report File, Jefferson County, Kentucky. Analysis by Forman & Associates.
The Vision Zero dataset doesn’t record driver behavior consistently, so this section uses NHTSA’s Fatality Analysis Reporting System (FARS), the national census of fatal crashes. These figures cover fatal crashes only in Jefferson County.
| Year | Fatal crashes | People killed | Driver BAC .08+ (tested) | Speeding-related | Driver distraction reported | Hit-and-run | Large truck involved |
|---|---|---|---|---|---|---|---|
| 2020 | 116 | 124 | 26 | 33 | 8 | 22 | 17 |
| 2021 | 116 | 124 | 27 | 26 | 13 | 22 | 12 |
| 2022 | 123 | 129 | 29 | 32 | 13 | 17 | 6 |
| 2023 | 130 | 134 | 28 | 29 | 11 | 28 | 12 |
| 2024 | 109 | 113 | 23 | 21 | 13 | 19 | 5 |
| 2020–2024 | 594 | 624 | 133 | 141 | 58 | 108 | 52 |
A driver who chose to drink, speed or text can be held responsible for the harm. See our pages on truck crashes and car crashes.
Source: NHTSA Fatality Analysis Reporting System (FARS), 2020–2023 Final File and 2024 Annual Report File, Jefferson County, Kentucky. Analysis by Forman & Associates. Annual Report File data for 2024 may change slightly when NHTSA releases the Final File.
You may see slightly different Louisville totals elsewhere. For 2023 and 2024, the Vision Zero data counts 136 and 114 people killed. NHTSA’s FARS and the Kentucky State Police’s annual Collision Facts report both count 134 and 113 for Jefferson County.
We don’t mix sources within a table. Each table names its source.
Download every figure in this report as a spreadsheet: Louisville crash data summary, 2016–2026 (CSV). Each row lists the table, category, measure, value, time period, source and notes.
How to cite: Forman & Associates Accident Injury Lawyers, “Louisville Car Accident Statistics: 10 Years of Crash Deaths and Serious Injuries (2016–2026),” analysis of Louisville Metro Public Works Vision Zero data and NHTSA FARS data, October 2026. Please also credit the original agency source.
The charts on this page may be republished with a link to this page.
How we counted. Years are by the local date of the crash. “People” counts each person killed or seriously injured. “Crashes” counts unique crash reports. Road totals use the main road named on the report; we standardized spellings (for example, “Dixie Hwy” and “Dixie Highway”). Intersection hot spots group crashes within about 250 feet. Percentages are rounded. Recent months are preliminary and may change as police reports are finalized.
What this report doesn’t cover. These datasets cover deaths and serious injuries. They don’t include the much larger number of crashes with minor injuries or property damage only. Totals are counts, not rates per mile driven or per resident.
Updates. We plan to refresh this report when Louisville Metro posts new monthly data and when NHTSA releases new FARS files.
In Louisville Metro, 100 people were killed in traffic crashes in 2025, 114 in 2024 and 136 in 2023, according to Louisville Metro Public Works’ Vision Zero data. Federal FARS data, which uses a slightly different definition, counts 113 deaths in Jefferson County in 2024.
By the number of people killed or seriously injured from 2021 to 2025, Dixie Highway ranks first among surface roads, with 59 killed and 157 seriously injured. Among interstates, I-264 had the most people killed or seriously injured (137), and I-265 had the most deaths (32).
In our analysis of 2021–2025 data, the intersection hot spots with the most fatal or serious-injury crashes were Cane Run Road at Crums Lane, 7th Street Road at Central Avenue, the Clark Memorial Bridge approach at Main Street, and Taylor Boulevard at Ashland Avenue. Three of the top ten are on West Broadway.
At night. Two-thirds of the people killed from 2021 to 2025 died in crashes between 6 p.m. and 6 a.m., and 10 p.m. was the deadliest hour. Sunday had the most fatal crashes.
170 pedestrians were killed in Louisville from 2021 to 2025, about 28% of all traffic deaths. The highest single year in the past 10 years was 2024, with 44 pedestrian deaths.
Yes. Please link to this page and credit the original source named with each table. You can download the CSV with every figure.
Statistics can’t capture what one crash does to a family. We can answer your questions about insurance, medical bills and deadlines.
Have a question about your case? Get a free case evaluation or call 502-931-6788.
This report summarizes publicly available government data for general information. It is not legal advice.